

Prometheus Monitoring on Kubernetes with Grafana
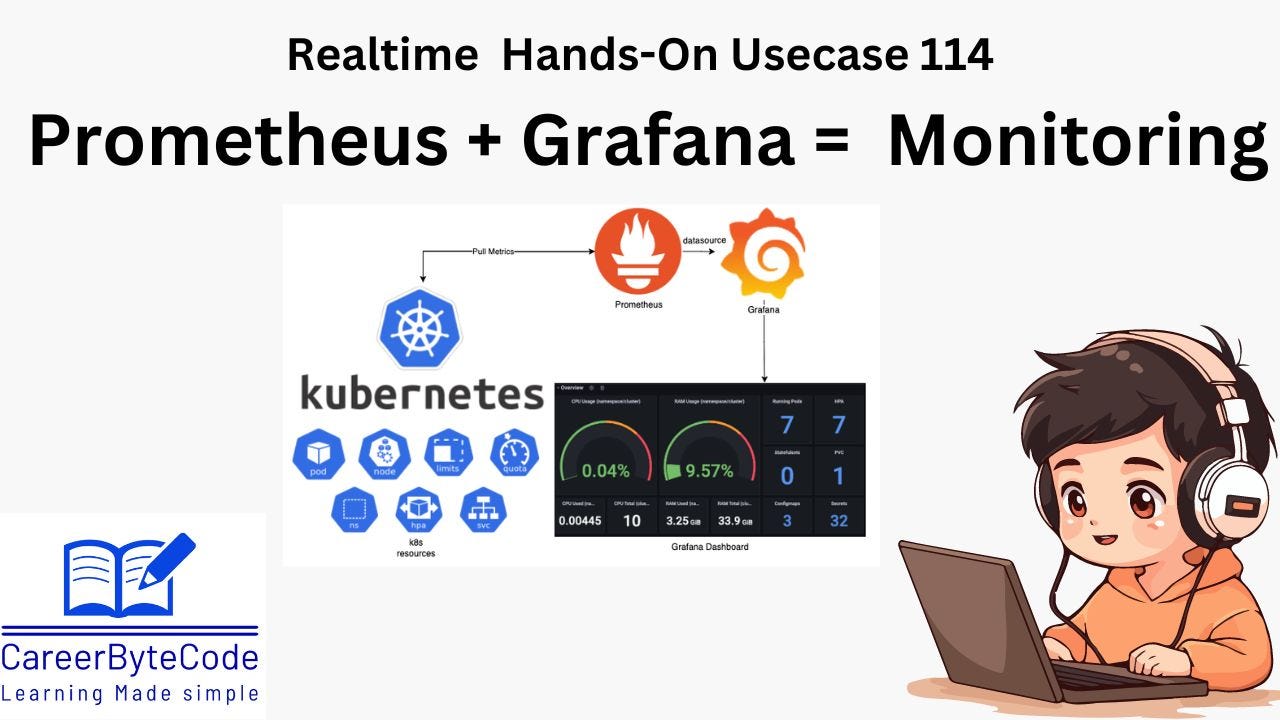
Prometheus, combined with Grafana, offers a powerful solution for monitoring Kubernetes clusters.

1. Why We Need This Use Case
In the fast-paced world of modern technology, monitoring and ensuring the health of your applications is crucial for a seamless user experience. Kubernetes is an excellent platform for managing containerized applications at scale, but tracking the performance and health of these applications can be challenging. Prometheus, combined with Grafana, offers a powerful solution for monitoring Kubernetes clusters by collecting and visualizing metrics, enabling proactive management and quick troubleshooting of potential issues.
2. When We Need This Use Case
This use case is essential when:
You have a Kubernetes cluster running multiple applications and need a robust monitoring solution.
You want to gain insights into the performance of your Kubernetes workloads and infrastructure.
You need to set up real-time dashboards and alerts to monitor the health and performance of your applications.
You are looking for a scalable and flexible monitoring system that integrates well with Kubernetes.
3. Prerequisites for the Lab
Keep reading with a 7-day free trial
Subscribe to CareerByteCode’s Substack to keep reading this post and get 7 days of free access to the full post archives.